Have you ever wondered what the rising and falling diagram you see on your camera LCD and in editing programs is? This chart is a histogram, which displays the range of tones in your image from dark to light. Nathaniel Dodson from tutvid explains the importance of histograms and how he uses them in Photoshop:
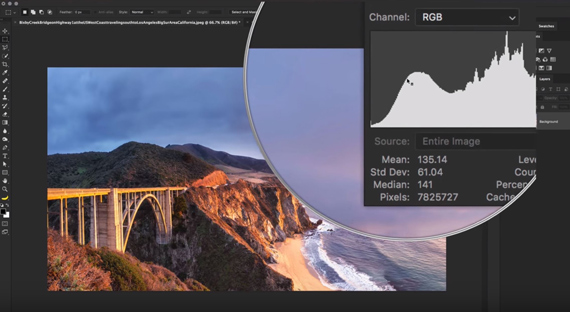
You can access this feature in Photoshop by clicking ‘Window’ in the top menu and scrolling down to ‘Histogram.’
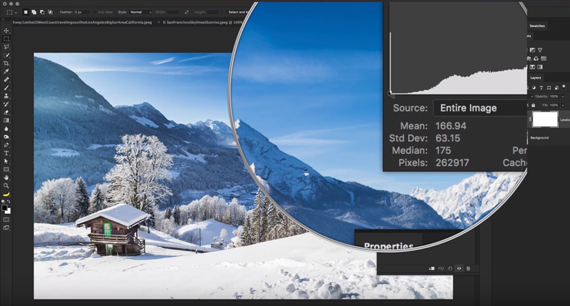
To read the histogram, you will notice that the dark tones are on the left side of the histogram while the brightest, solid white parts of the photo are on the right. As you move from left to right, the tones become brighter.
If you want to adjust your histogram, try using the ‘Curves’ feature in Photoshop. The linear line shown can be manipulated by placing your cursor on it to click and drag. If you move it upward, the tones brighten. This shifts your histogram right toward the brighter tones. They can be darkened by pulling downward instead, pushing your histogram to the left.
By looking at your camera’s histogram for a photo, you can tell if it is under or over exposed based on whether the histogram is weighted to the right or the left.
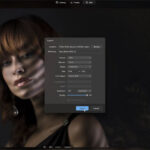
Another adjustment you can makes uses the ‘Levels’ feature in Photoshop. This also shows your histogram while editing a photo. Here, you can utilize the sliders to move your brightest or darkest tones toward the center. The scale goes from 0 to 255, with 0 being the darkest a pixel can be and 255 being the lightest. You are also able to view the histogram for your red, blue, and green channels. By adjusting the sliders and points on the chart, you can observe a new way of changing the lighting in your photos.
Try using and studying your histogram to learn more about your camera settings and how to influence them in editing!
Like This Article?
Don't Miss The Next One!
Join over 100,000 photographers of all experience levels who receive our free photography tips and articles to stay current:


Wonderful Article. About as useful as knowing a traffic light has a red, green and yellow circle in it.
Though I do admit you did describe a histogram accurately.
On the off chance that you need to change your histogram, have a go at utilizing the ‘Bends’ highlight in Photoshop. The direct line indicated can be controlled by setting your cursor on it to snap and drag. In the event that you move it upward, the tones light up. This moves your histogram ideal toward the more splendid tones. They can be obscured by pulling descending rather, pushing your histogram to one side.