If you’ve ever looked at the data behind a digital image, chances are you’ve come across a histogram. Histograms—graphical representations of the exposure of images—can be incredibly beneficial to photographers. Unfortunately, there’s quite a bit of misinformation circulated about how a histogram functions and what information it’s meant to convey. In this video, Matt Granger debunks a few common myths and explains how this tool can be of use:
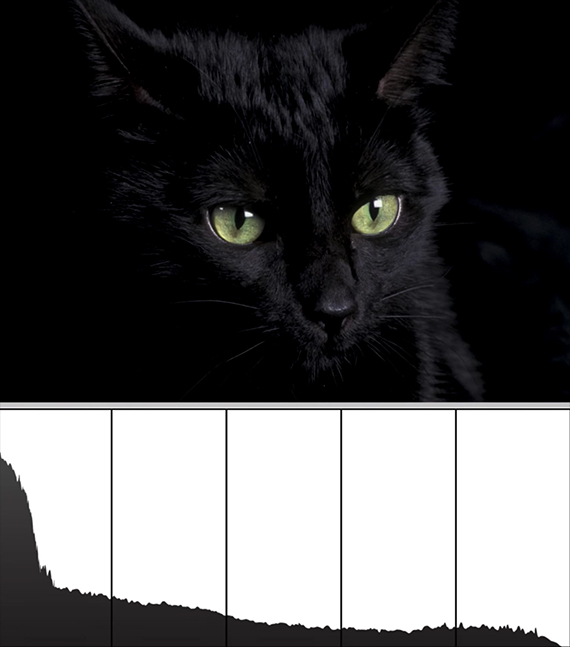
First, it’s important to understand just what exactly a histogram projects. Each individual histogram reveals the tonal data in a photograph. If the sensor hits pure black or pure white—and subsequently ceases to record data—the bar graph will reveal it.
One of the most common misunderstandings is that an ideal histogram exists. It’s true that in most situations, you’ll find a range of shadows, highlights, and midtones. However, an image that doesn’t have an even spread of tonality isn’t necessarily bad or wrong. For instance, it’s perfectly acceptable to have a histogram that skews one way if you’re trying to make a low key shot of a dark subject on a dark background (or vice versa). Almost always, you’re going to want to stay faithful to the way things actually look. So, if you’re working with a scene illuminated by candle light, something might be wrong with your exposure if your histogram reveals a large range of tonality with strong highlights.
Another important factor to keep in mind is that the histogram displayed on your camera reflects the JPEG version of an image, even if you’re working in Raw. When you bring the image into the computer, you’ll notice a different histogram is generated based on the actual distribution within the Raw file. Many professionals seeking versatile, large photo files opt for Raw formatting and are completely unaware of this detail. Raw files contain more information, meaning that their histogram charts have a larger, more detailed range to work with. So, if your in-camera histogram says that you’re losing data in the image’s highlights or shadows, don’t fret—your raw file may actually be capturing more than the camera is letting on. To combat any confusion, test your gear to get a more accurate idea of its limitations. In addition, wait to import your images before deleting anything; there may be some details that you’re capturing that aren’t visible on your DSLR’s LCD screen.
Last but not least, remember that not all lenses capture the same histogram, even if all of the camera’s other settings are left untouched and the lenses are set to the same focal length. Different lenses transmit different amounts of light. Some lenses include heavy vignetting, others are drastically effected by flare. The truth of the matter is that each lens has its own set of eccentricities. Take mental notes of how your camera handles different situations and apply that knowledge appropriately when reading the camera’s histogram results.
“Your histogram is the most reliable way…to get an idea of what’s going on with the exposure in your shot…looking at your histogram will actually tell you in a graphical bar chart if you’ve hit perfect black or perfect white.”
Like This Article?
Don't Miss The Next One!
Join over 100,000 photographers of all experience levels who receive our free photography tips and articles to stay current:


Leave a Reply